Which of the 20 student tags are gendered — and how well do tags alone predict ratings and difficulty?

Questions 4, 8, 9

Q4 · Which tags are gendered?

The question — Do students describe male and female professors with different teaching tags — Hilarious, Caring, Tough grader, and so on?

How we answer it — Test each of the 20 tags (normalized per rating) for a male/female difference, then control the false-discovery rate across all 20 tests with Benjamini–Hochberg at α = 0.005.

Code
res, figs = questions.q4()
print(f"{res['n_significant_fdr']} of 20 tags differ significantly by gender (FDR @ 0.005)")
print("most gendered :", ", ".join(res["most_gendered"]))
print("least gendered:", ", ".join(res["least_gendered"]))
show(figs, "q4_tag_significance")
17 of 20 tags differ significantly by gender (FDR @ 0.005)
most gendered : hilarious, caring, amazing_lectures
least gendered: tough_grader, accessible, pop_quizzes
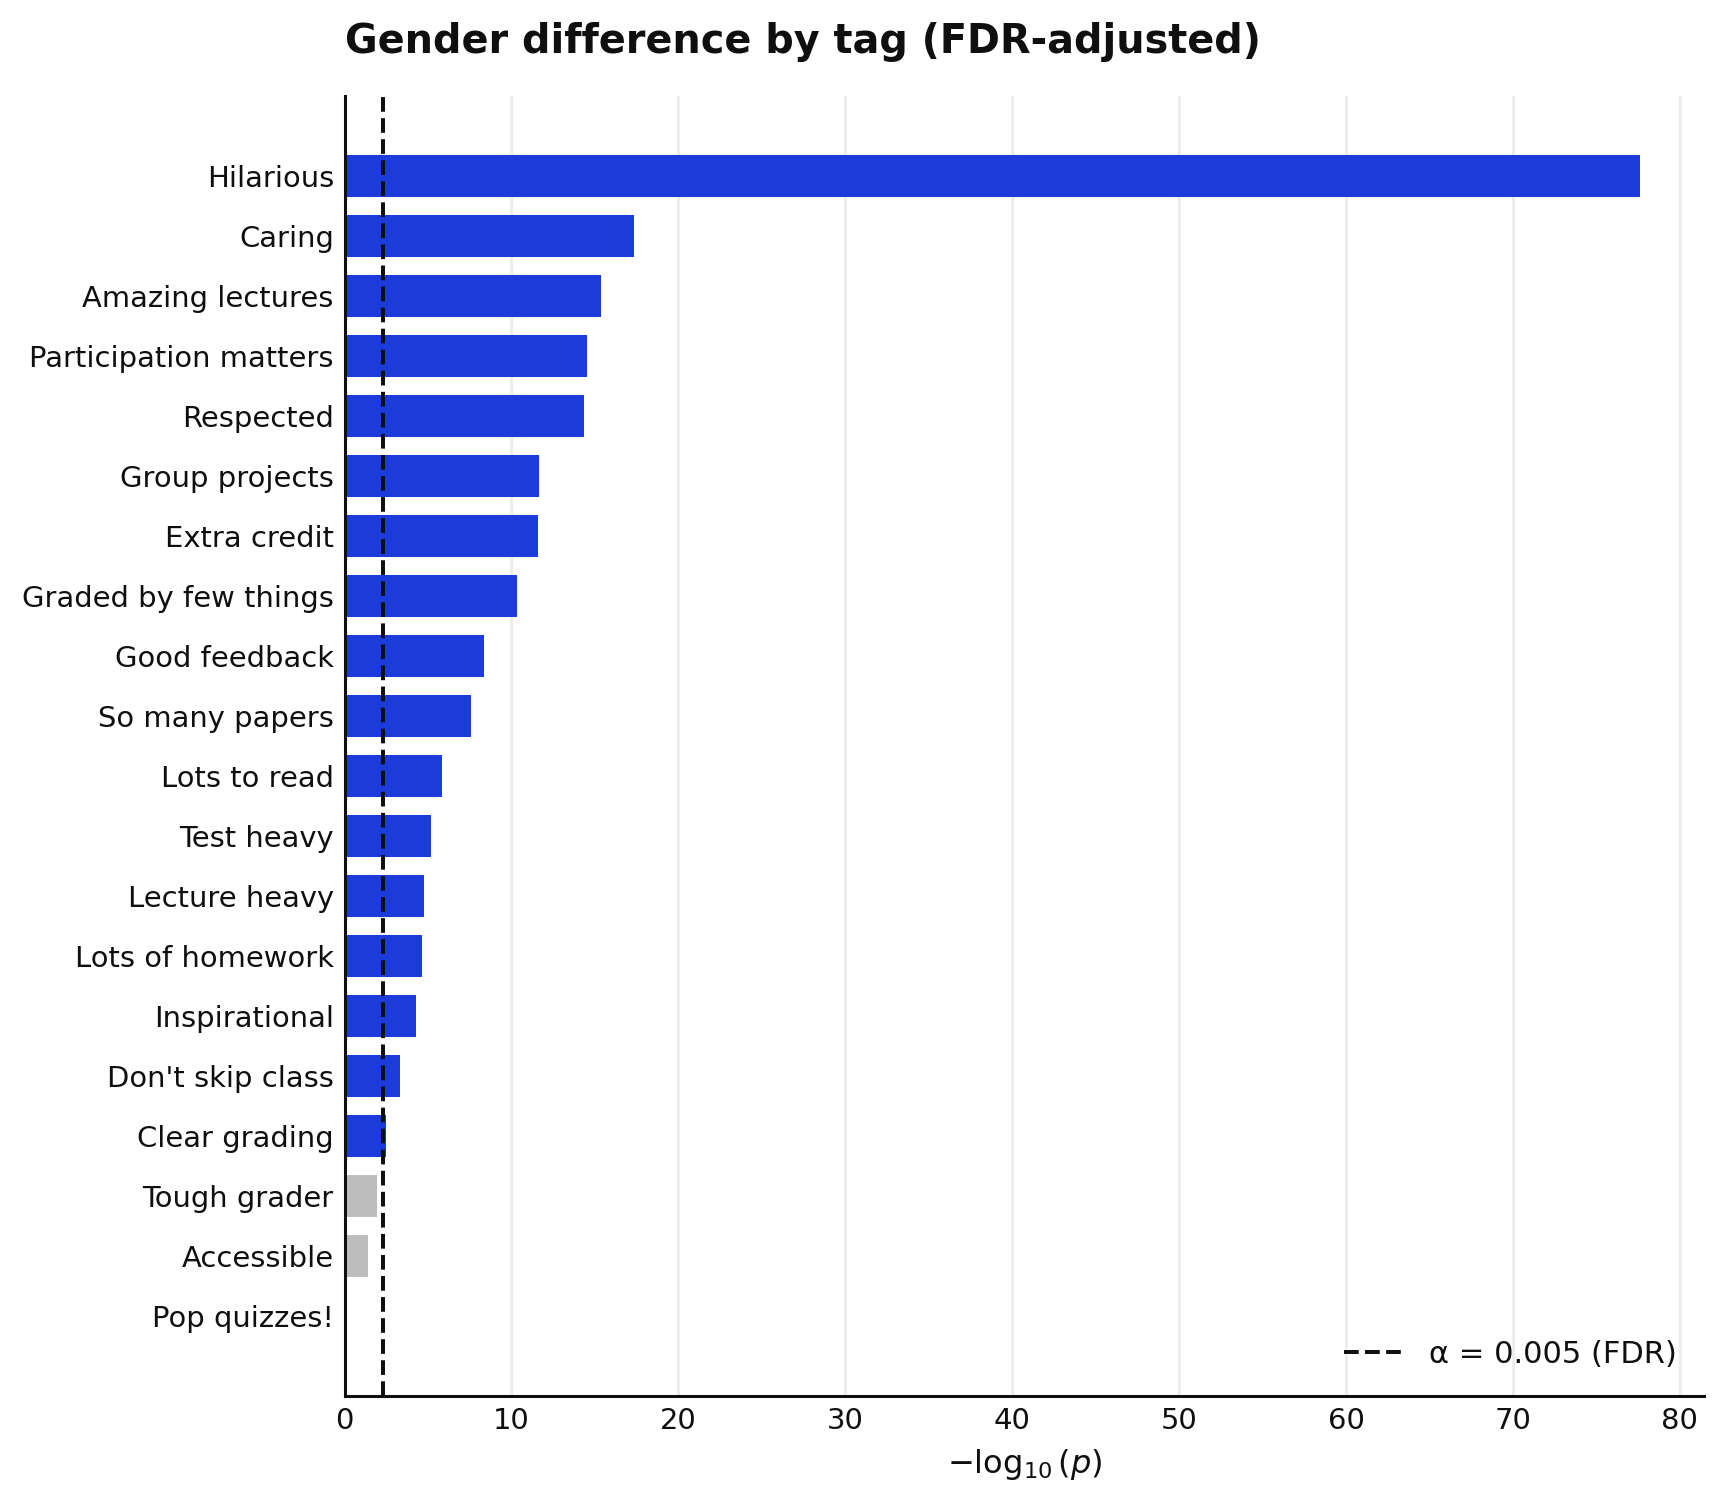
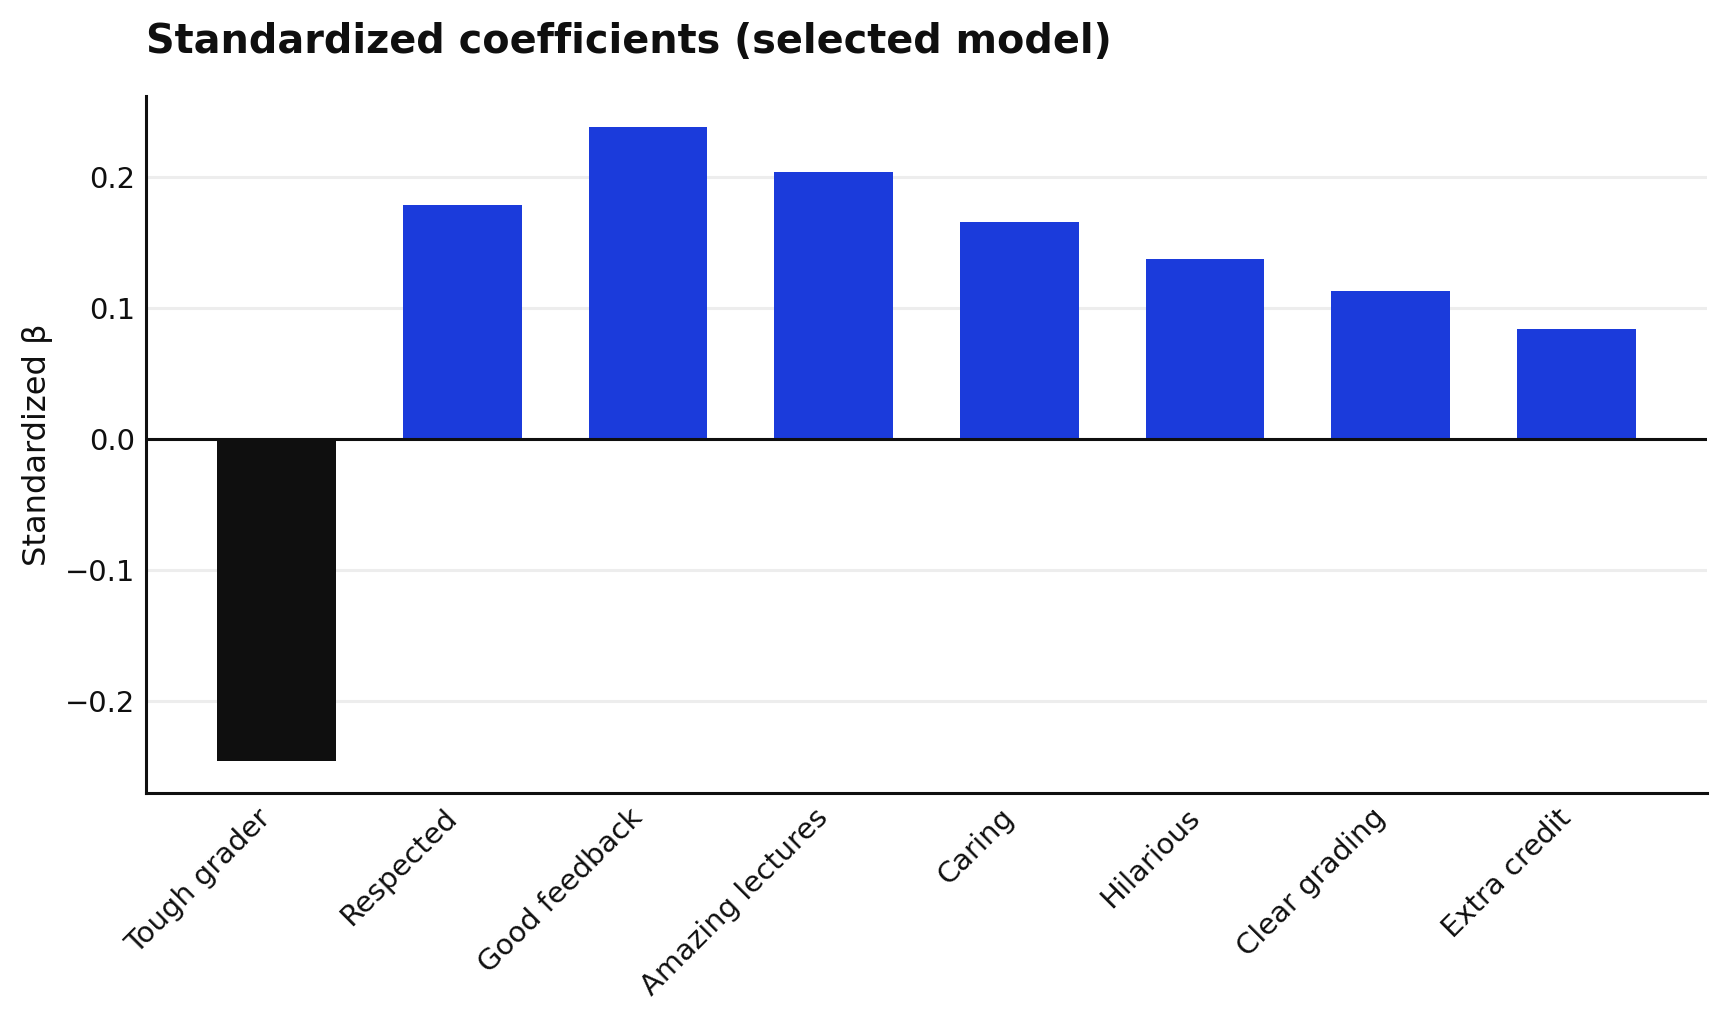
Figure 1: Per-tag gender difference as −log10(FDR-adjusted p). Bars past the dashed line are significant; grey bars are not.

Finding. 17 of 20 tags are gendered. Hilarious is overwhelmingly the most gendered (men receive it far more), followed by Caring and Amazing lectures. The only three that don’t clear the bar are Tough grader, Accessible, and Pop quizzes!

With 20 simultaneous tests, an uncorrected p < 0.05 would flag roughly one tag as “significant” by chance alone. Benjamini–Hochberg controls the expected proportion of false discoveries — less conservative than Bonferroni, and appropriate when many true effects are expected.

Q8 · Predicting rating from tags

The question — How much of a professor’s rating can the tags alone explain, and which tag carries the most weight?

How we answer it — Forward-select tags using 5-fold cross-validation, then read the standardized coefficients of the chosen model.

Code
res8, figs8 = questions.q8()
print("selected tags:", ", ".join(res8["best_features"]))
print(f"R² = {res8['best_r2']:.3f}   RMSE = {res8['best_rmse']:.3f}")
print(f"strongest predictor: {res8['top_predictor']} (β = {res8['top_predictor_beta']:.3f})")
show(figs8, "q8_coefficients")
selected tags: tough_grader, respected, good_feedback, amazing_lectures, caring, hilarious, clear_grading, extra_credit
R² = 0.744   RMSE = 0.448
strongest predictor: tough_grader (β = -0.245)
Figure 2: Standardized coefficients of the selected tag model for average rating (cobalt = positive, black = negative).

Finding. Tags explain a lot of rating variance (R² ≈ 0.74). Tough grader is the strongest predictor, and it pulls ratings down. This is a touch weaker than the numeric-feature model in Models, where “would retake” alone is extremely predictive.

Q9 · Predicting difficulty from tags

The question — Same idea for difficulty: which tags best predict how hard a professor is perceived to be?

How we answer it — Forward selection over the 20 tags, predicting average difficulty.

Code
res9, figs9 = questions.q9()
print("selected tags:", ", ".join(res9["best_features"]))
print(f"R² = {res9['best_r2']:.3f}   RMSE = {res9['best_rmse']:.3f}")
print(f"strongest predictor: {res9['top_predictor']} (β = {res9['top_predictor_beta']:.3f})")
show(figs9, "q9_coefficients")
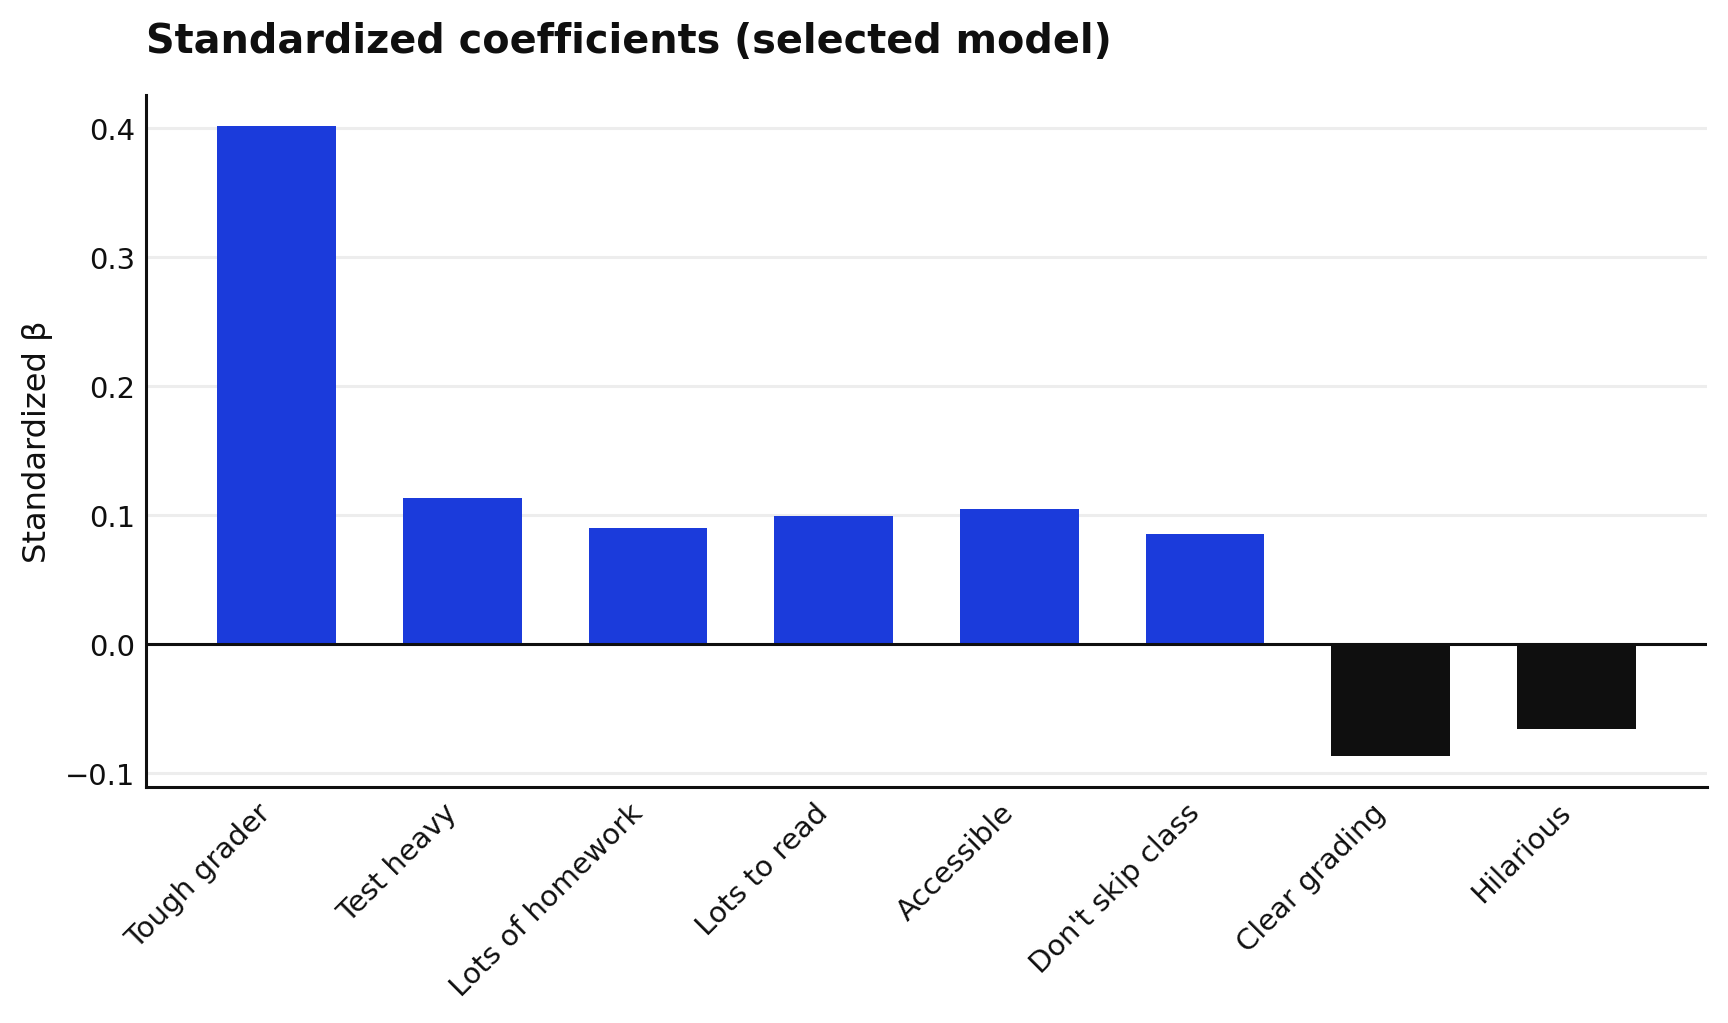
selected tags: tough_grader, test_heavy, lots_of_homework, lots_to_read, accessible, dont_skip, clear_grading, hilarious
R² = 0.600   RMSE = 0.479
strongest predictor: tough_grader (β = 0.401)
Figure 3: Standardized coefficients of the selected tag model for average difficulty.

Finding. Tags predict difficulty a little less well (R² ≈ 0.60). Here Tough grader is again the strongest predictor, but now positive — the mirror image of Q8, which makes intuitive sense: tough graders are rated harder and liked less.