A geographic bonus question, and where this analysis would go next.
Bonus question
Q11 · New York vs. New Jersey
The question — Do professors in two neighbouring states (NY vs. NJ) receive systematically different ratings?
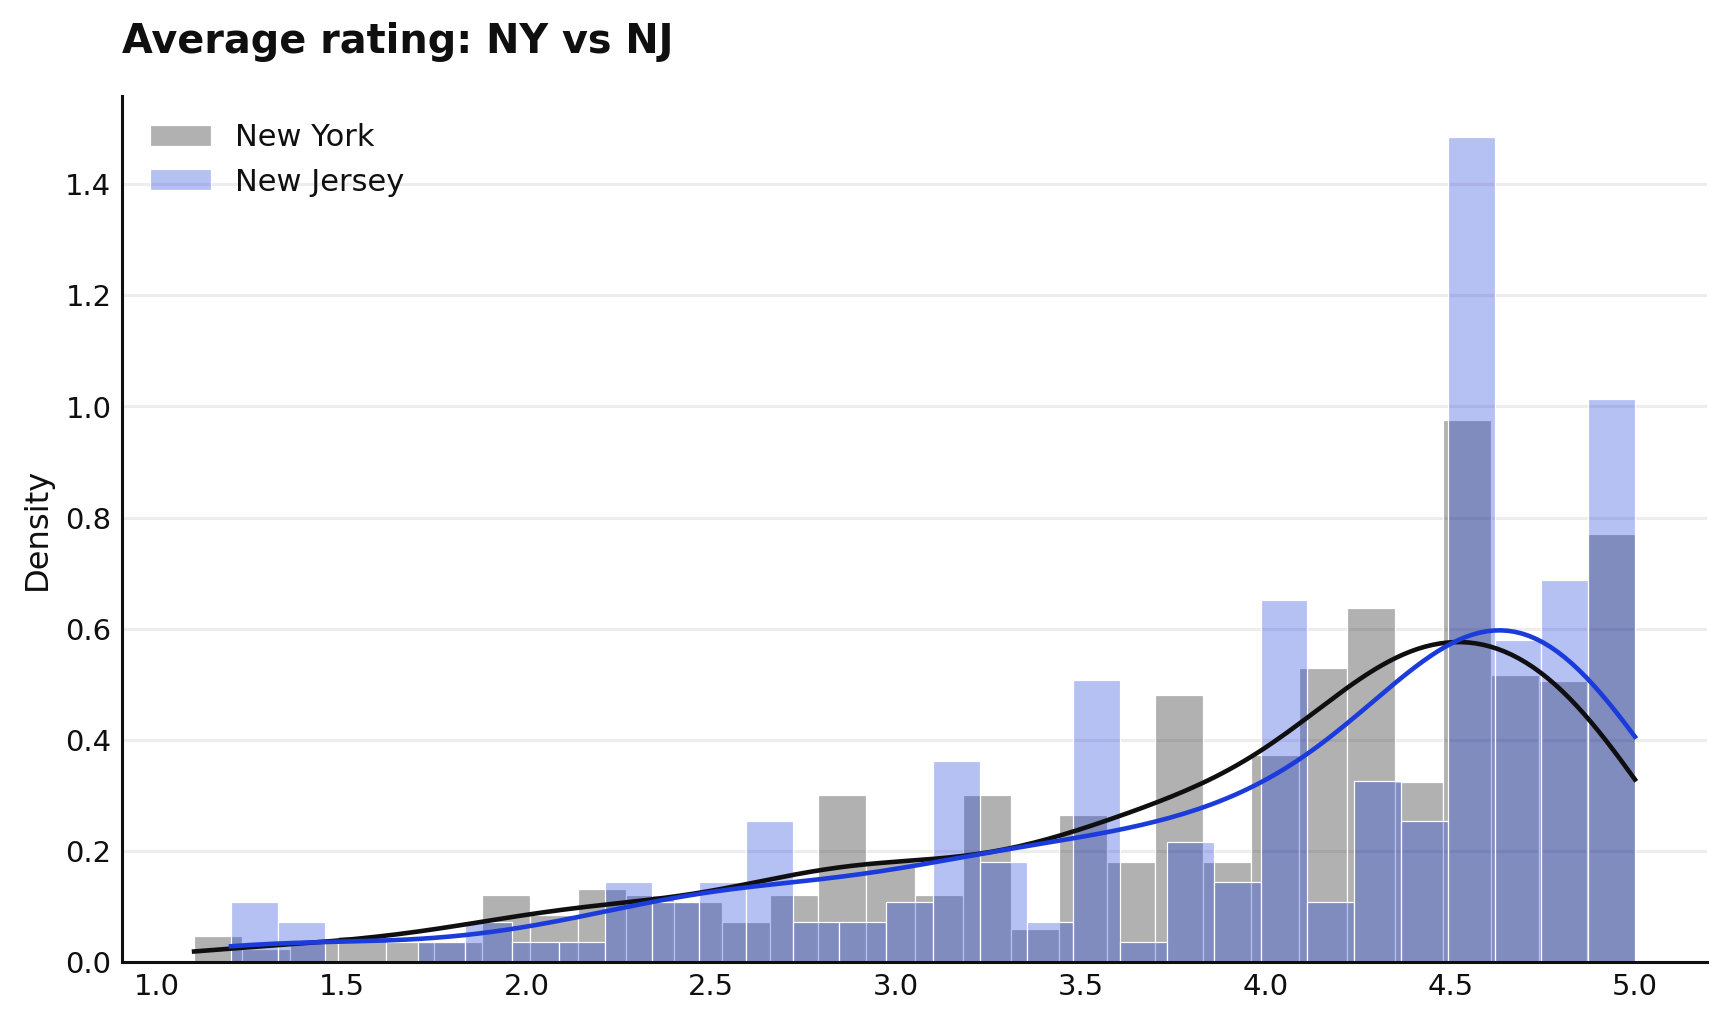
How we answer it — Using the qualitative file’s state column, compare NY vs. NJ rating distributions (professors with ≥ 10 ratings) with Mann–Whitney U and KS tests.
Code
res, figs = questions.q11()print(f"NY: mean {res['ny_mean']:.3f} (n={res['n_ny']})")print(f"NJ: mean {res['nj_mean']:.3f} (n={res['n_nj']})")print(f"Mann-Whitney U: p = {res['mwu_p']:.3f} KS: p = {res['ks_p']:.3f}")show(figs, "q11_ny_vs_nj")
NY: mean 3.918 (n=639)
NJ: mean 4.011 (n=218)
Mann-Whitney U: p = 0.062   KS: p = 0.021
Figure 1: NY vs. NJ average-rating distributions — visually and statistically indistinguishable at α = 0.005.
Finding. No significant difference at α = 0.005 (MWU p ≈ 0.06). NJ trends a hair higher, but with 218 NJ professors the difference isn’t reliable. Geography, at least for these two neighbours, doesn’t move the needle.
Where we’d take this next
Future work
Hierarchical models. Ratings cluster by university and major. A mixed-effects model with random intercepts per school would separate “this professor is good” from “this school rates generously”, and sharpen the gender estimate after controlling for institution.
Text & tags together. Combine the tag signal with the qualitative fields (major, university) to ask where gender bias concentrates — is the pro-male gap larger in some disciplines?
Causal framing. The current analysis is associational. Matching male/female professors on difficulty, department, and rating count would tighten the bias estimate.
Calibrated, fairness-aware classifier. For the pepper model, calibrate the predicted probabilities and check whether error rates differ by gender — a natural fairness audit.
Reproduce it yourself
git clone https://github.com/deepanshumody/Analysis_RMP_Ratingscd Analysis_RMP_Ratingsmake setup # create a venv and install the ape packagemake test # 42 tests: from-scratch ML validated against scikit-learnmake analysis # regenerate every figure + results.json
Source Code
---title: "Extensions"subtitle: "A geographic bonus question, and where this analysis would go next."---```{python}#| label: setup#| echo: falseimport matplotlib.pyplot as pltfrom IPython.display import displayfrom ape import questionsdef show(figs, *keys):"""Display only the named figures; close the rest so nothing leaks."""for k, f in figs.items():if k notin keys: plt.close(f)for k in keys: display(figs[k]) plt.close("all")```[Bonus question]{.kicker}## Q11 · New York vs. New Jersey::: {.qbrief}**The question** — Do professors in two neighbouring states (NY vs. NJ) receive systematically different ratings?**How we answer it** — Using the qualitative file's state column, compare NY vs. NJ rating distributions (professors with ≥ 10 ratings) with Mann–Whitney U and KS tests.:::```{python}#| label: fig-q11#| fig-cap: "NY vs. NJ average-rating distributions — visually and statistically indistinguishable at α = 0.005."res, figs = questions.q11()print(f"NY: mean {res['ny_mean']:.3f} (n={res['n_ny']})")print(f"NJ: mean {res['nj_mean']:.3f} (n={res['n_nj']})")print(f"Mann-Whitney U: p = {res['mwu_p']:.3f} KS: p = {res['ks_p']:.3f}")show(figs, "q11_ny_vs_nj")```**Finding.** No significant difference at α = 0.005 (MWU p ≈ 0.06). NJ trends a hair higher, but with218 NJ professors the difference isn't reliable. Geography, at least for these two neighbours, doesn'tmove the needle.## Where we'd take this next[Future work]{.kicker}- **Hierarchical models.** Ratings cluster by university and major. A **mixed-effects model** with random intercepts per school would separate "this professor is good" from "this school rates generously", and sharpen the gender estimate after controlling for institution.- **Text & tags together.** Combine the tag signal with the qualitative fields (major, university) to ask *where* gender bias concentrates — is the pro-male gap larger in some disciplines?- **Causal framing.** The current analysis is associational. Matching male/female professors on difficulty, department, and rating count would tighten the bias estimate.- **Calibrated, fairness-aware classifier.** For the pepper model, calibrate the predicted probabilities and check whether error rates differ by gender — a natural fairness audit.## Reproduce it yourself```bashgit clone https://github.com/deepanshumody/Analysis_RMP_Ratingscd Analysis_RMP_Ratingsmake setup # create a venv and install the ape packagemake test # 42 tests: from-scratch ML validated against scikit-learnmake analysis # regenerate every figure + results.json```