numeric file : 89,893 professors × 8 columns
tags file    : 89,893 professors × 20 columns
qual file : 89,893 professors × 3 columnsThe data
Where it comes from, what each record contains, and why we clean it the way we do.
Dataset
The data come from RateMyProfessor.com, where students rate instructors on quality and difficulty and tag their teaching style. The professor scraped, anonymized, and collated the site into three aligned files — one row per professor, 89,893 professors in total, in the same order across all three files.
What each professor record contains
rmpCapstoneNum.csv — the quantitative facts about each professor:
| Column | Meaning |
|---|---|
avg_rating |
Mean of all quality ratings (1–5) |
avg_difficulty |
Mean of all difficulty ratings (1–5) |
num_ratings |
How many ratings the averages are based on |
received_pepper |
Whether students judged the professor “hot” (a 🌶️ on RMP) — boolean |
prop_retake |
Proportion of students who said they’d take the class again |
num_online |
How many ratings came from online classes |
high_conf_male |
Flagged male with high confidence — boolean |
high_conf_female |
Flagged female with high confidence — boolean |
rmpCapstoneQual.csv — three qualitative fields: major / field, university, and US state.
A look at the raw numbers
A few real rows (numeric file):
| avg_rating | avg_difficulty | num_ratings | received_pepper | prop_retake | num_online | high_conf_male | high_conf_female | |
|---|---|---|---|---|---|---|---|---|
| 0 | 5.0 | 1.5 | 2.0 | 0.0 | NaN | 0.0 | 0 | 1 |
| 1 | NaN | NaN | NaN | NaN | NaN | NaN | 0 | 0 |
| 2 | 3.2 | 3.0 | 4.0 | 0.0 | NaN | 0.0 | 1 | 0 |
| 3 | 3.6 | 3.5 | 10.0 | 1.0 | NaN | 0.0 | 0 | 0 |
| 4 | 1.0 | 5.0 | 1.0 | 0.0 | NaN | 0.0 | 0 | 0 |
| 5 | 3.5 | 3.3 | 22.0 | 0.0 | 56.0 | 7.0 | 1 | 0 |
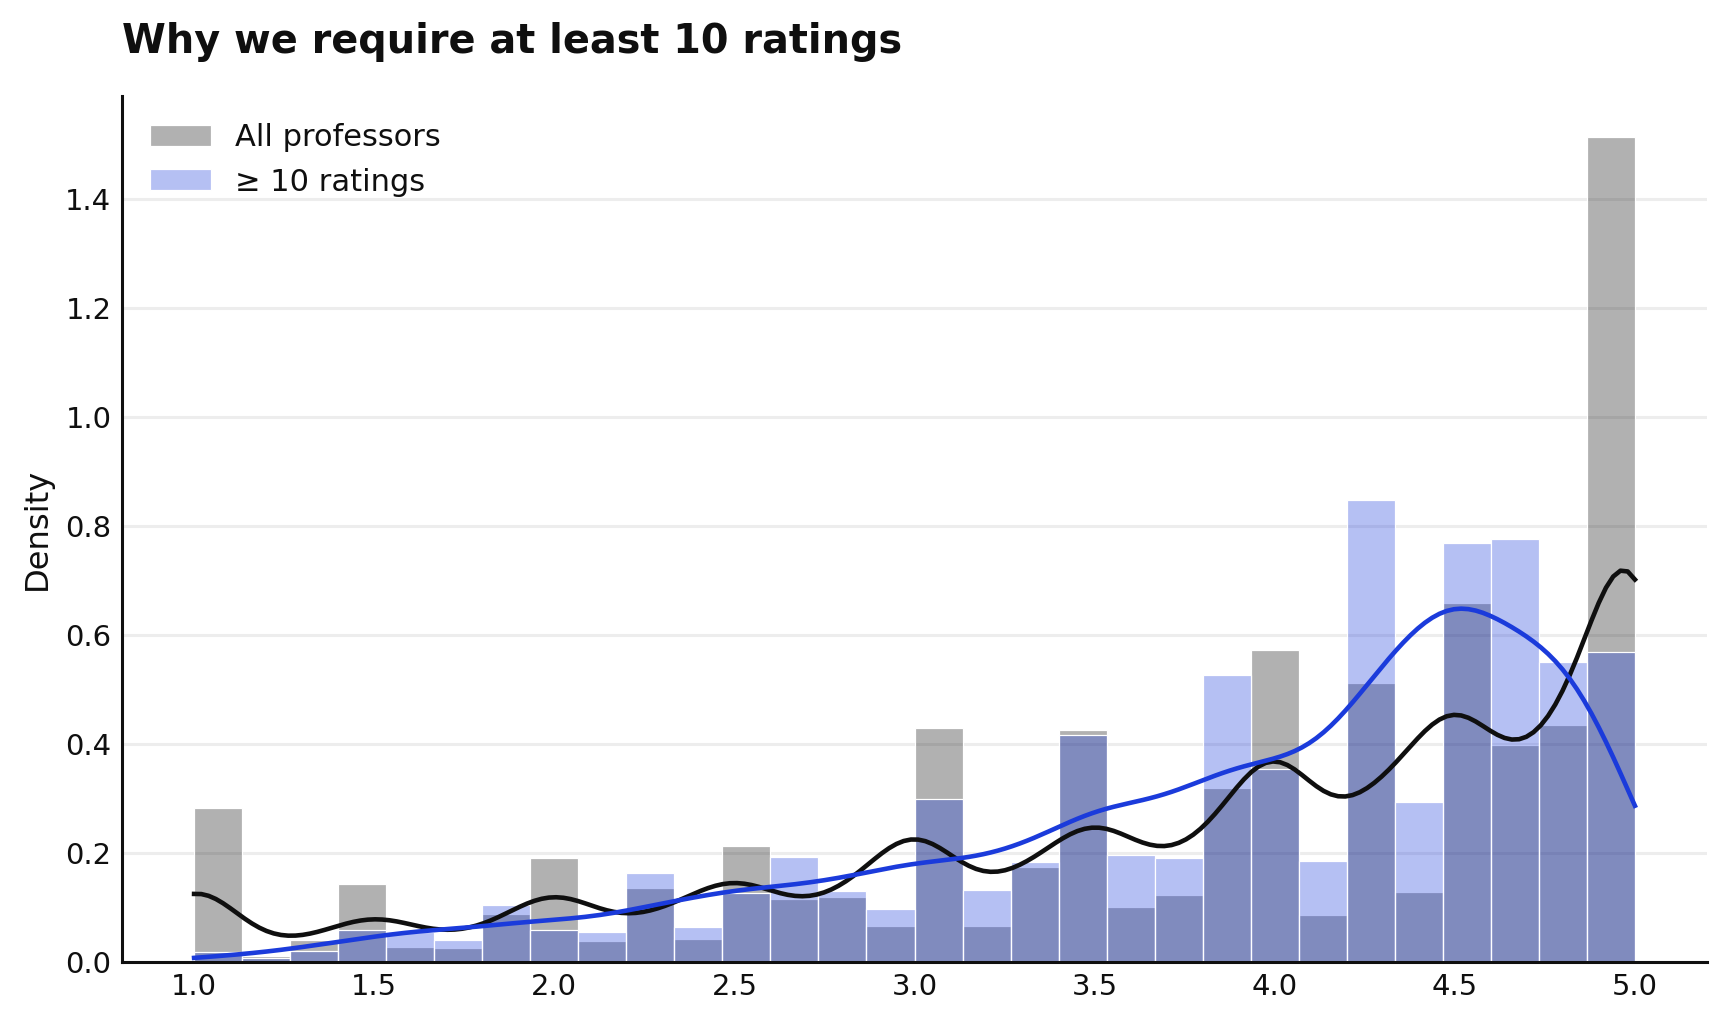
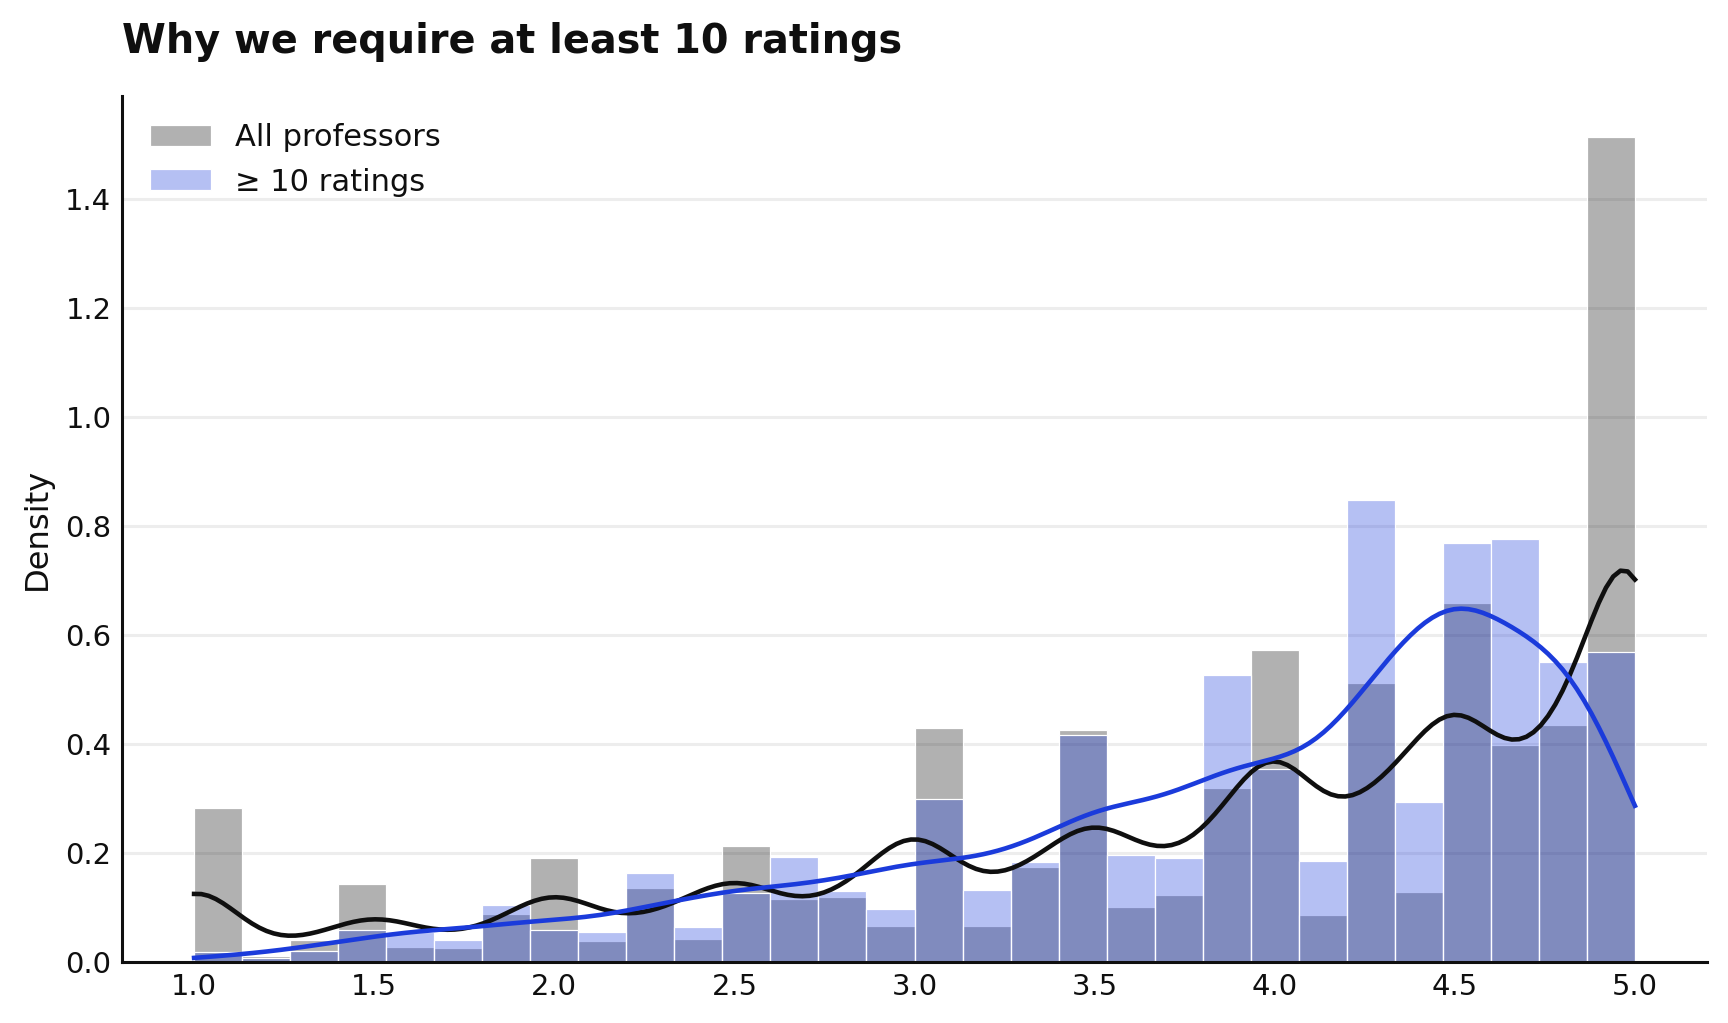
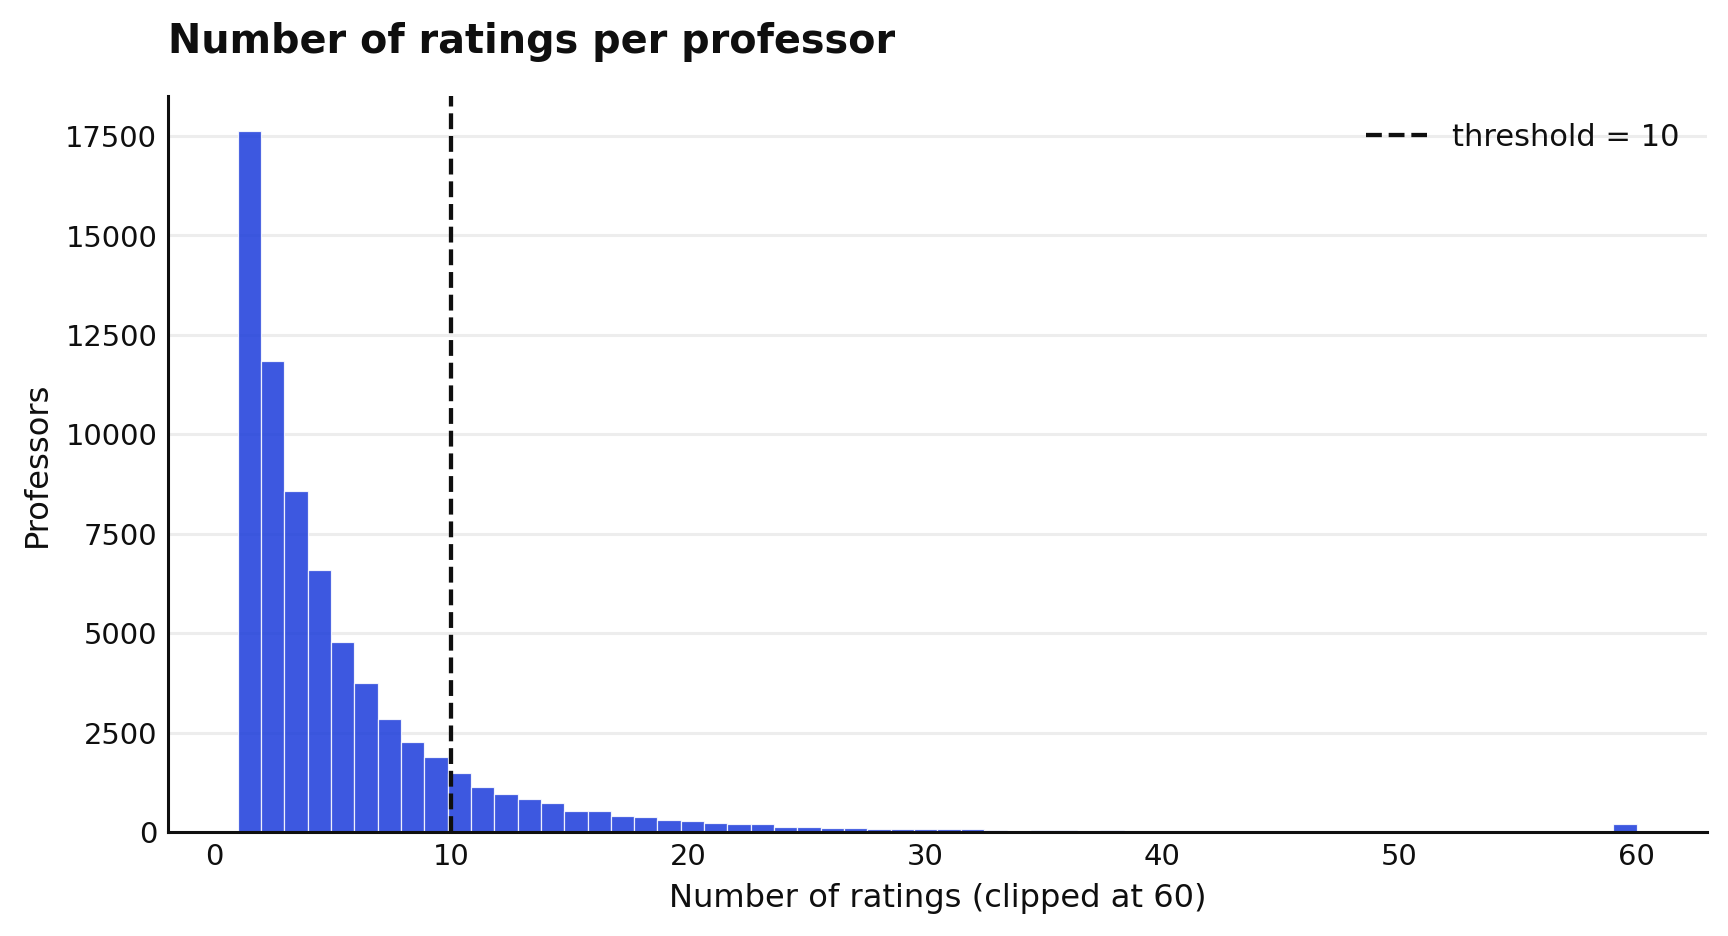
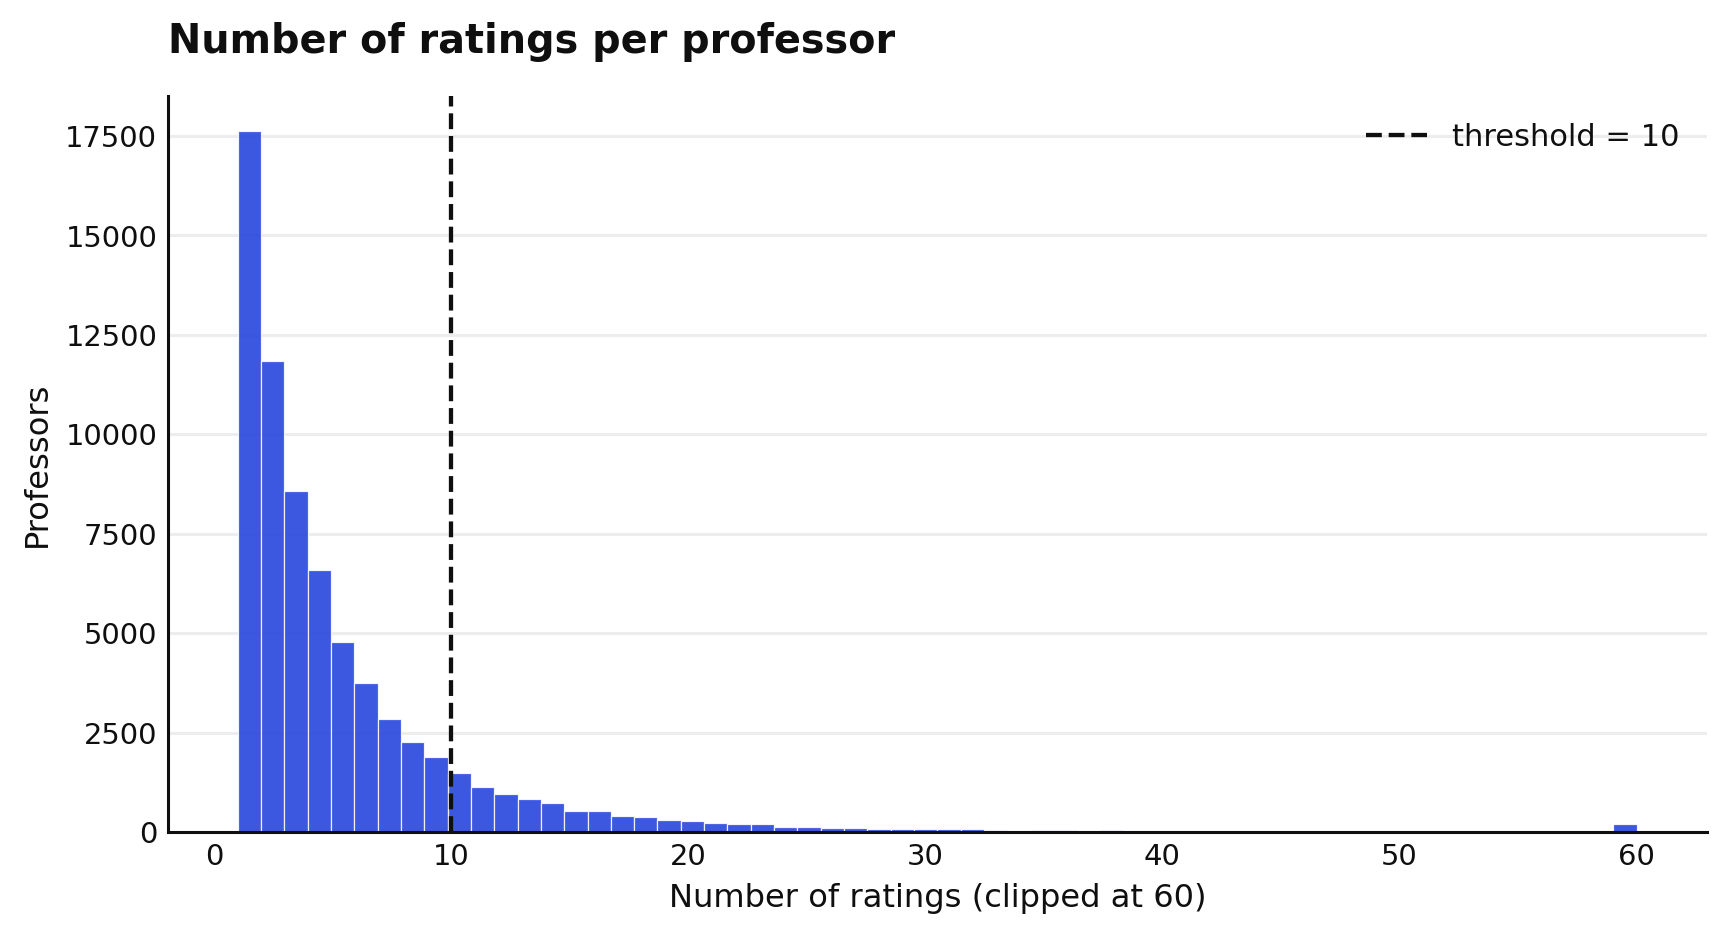
The single most important cleaning choice is a minimum-ratings threshold. An average built on one or two ratings is unstable — it piles up at the integer values 1, 2, …, 5. Requiring ≥ 10 ratings trades sample size for trustworthy averages:
Missing data
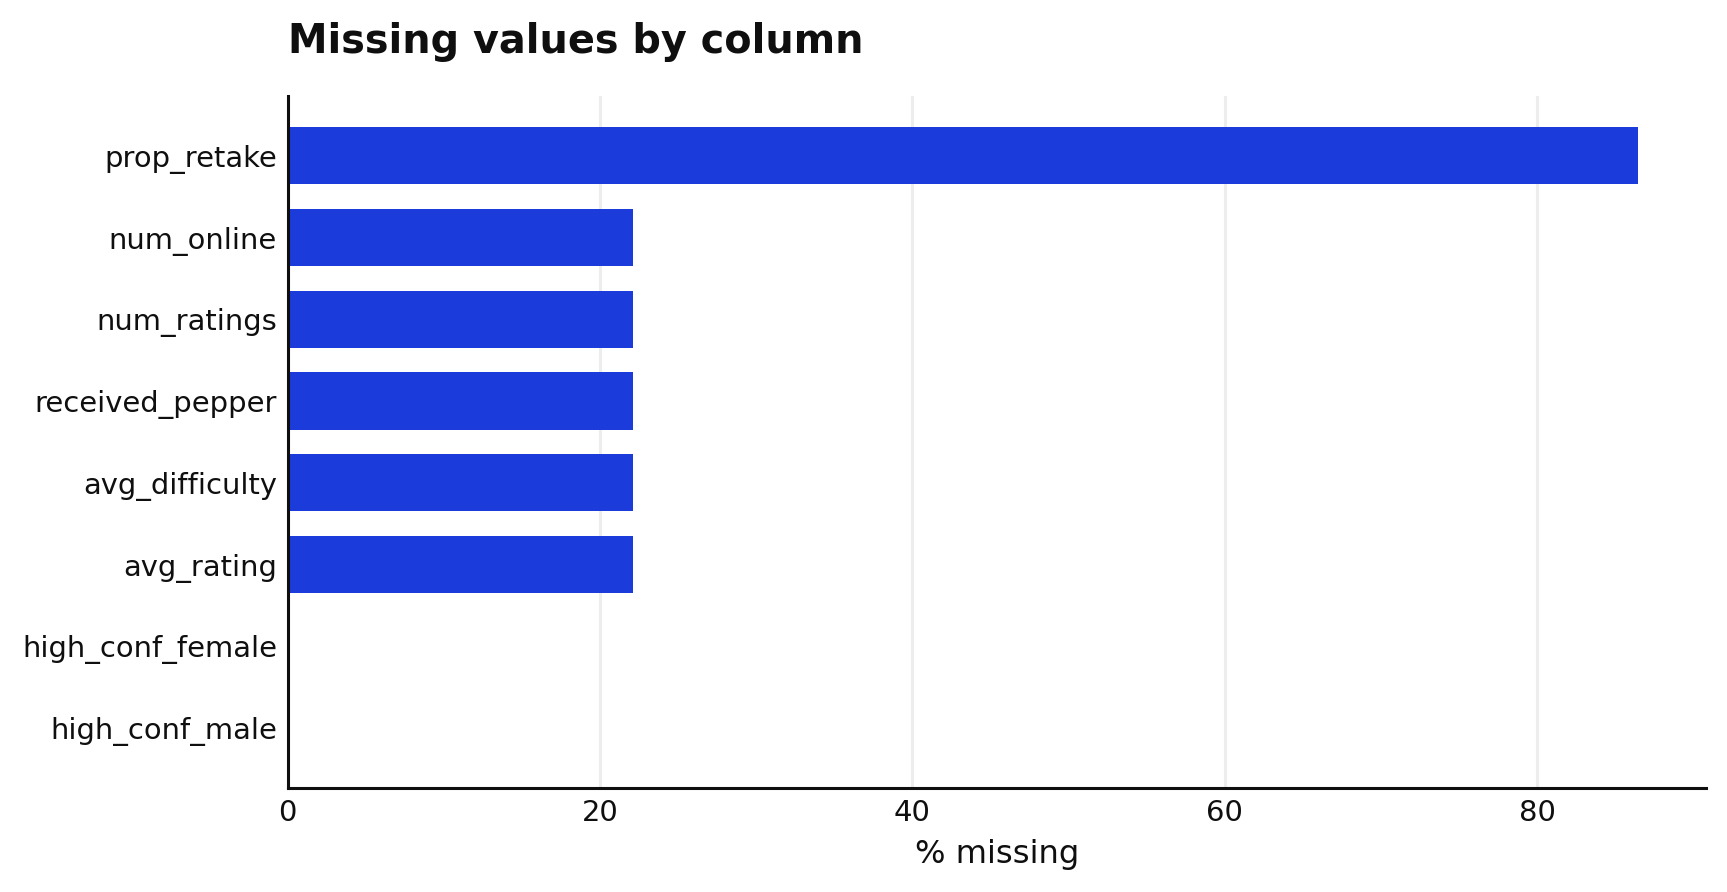
Some fields are missing — professors with no ratings, and the would-retake proportion (often absent). We handle this per question: dropping incomplete rows where a model needs the field, and otherwise working with what’s available.
From raw to analysis-ready
all professors                     : 89,893
  with >= 10 ratings               :  9,841
    and a high-confidence gender    :  7,105  (3987 M / 3118 F)
The exact cleaning, the α = 0.005 significance threshold, the RNG seed, and our statistical choices are detailed on the Methods page.